Japanese
×
Company
Products
News
Sustainability
Financial Information
Careers
Japanese
Company
Corporate Philosophy, Vision 2030
Corporate Profile
Global Network
History
Quick Facts and Figures
Products
Materials Handling Equipment
TOYOTA
RAYMOND
Automobile
Vehicles
Engines
Car Air-Conditioning Compressors
Car Electronics
Batteries
Stamping Dies
Textile Machinery
Weaving Machinery
Spinning Machinery
Sustainability
Message from the President
Sustainability Management
Value Creation Process
Toyota Industries Group Sustainability Policy
Sustainability Material Issues (Materiality)
Implementation Structure
Environmental Initiatives
Environmental Management
Climate Change
Resource Recycling
Harmony with Nature
Respect for Human Rights
Corporate Governance
Relationship with Stakeholders
Customers
Business Partners
Associates
Local Communities
Data Library
Financial Information
Performance and Ratings
Disclosed Documents
Careers
What We Do
Who We Are
Home
Financial Information
Performance and Ratings
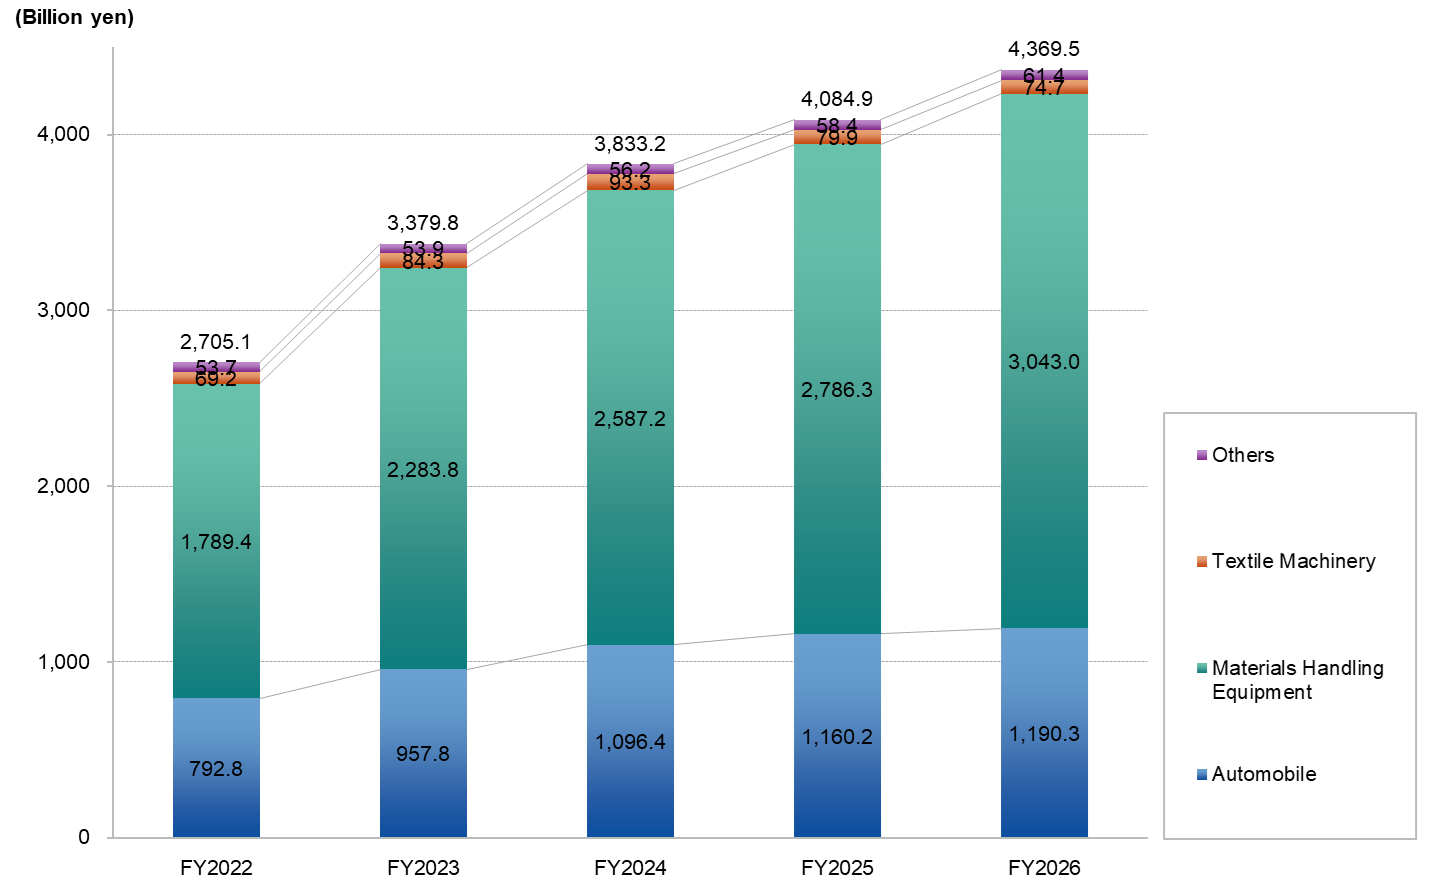
Sales by Segment(IFRS)
Sales by Segment(IFRS)
Consolidated/ Annual
(Billion yen)
FY 2022
FY 2023
FY 2024
FY2025
FY2026
Automobile
792.8
957.8
1,096.4
1,160.2
1,190.3
Materials Handling Equipment
1,789.4
2,283.8
2,587.2
2,786.3
3,043.0
Textile Machinery
69.2
84.3
93.3
79.9
74.7
Others
53.7
53.9
56.2
58.4
61.4
Download this Excel file
Home
Financial Information
Performance and Ratings
Sales by Segment(IFRS)