Financial Highlights(IFRS)
Net Sales
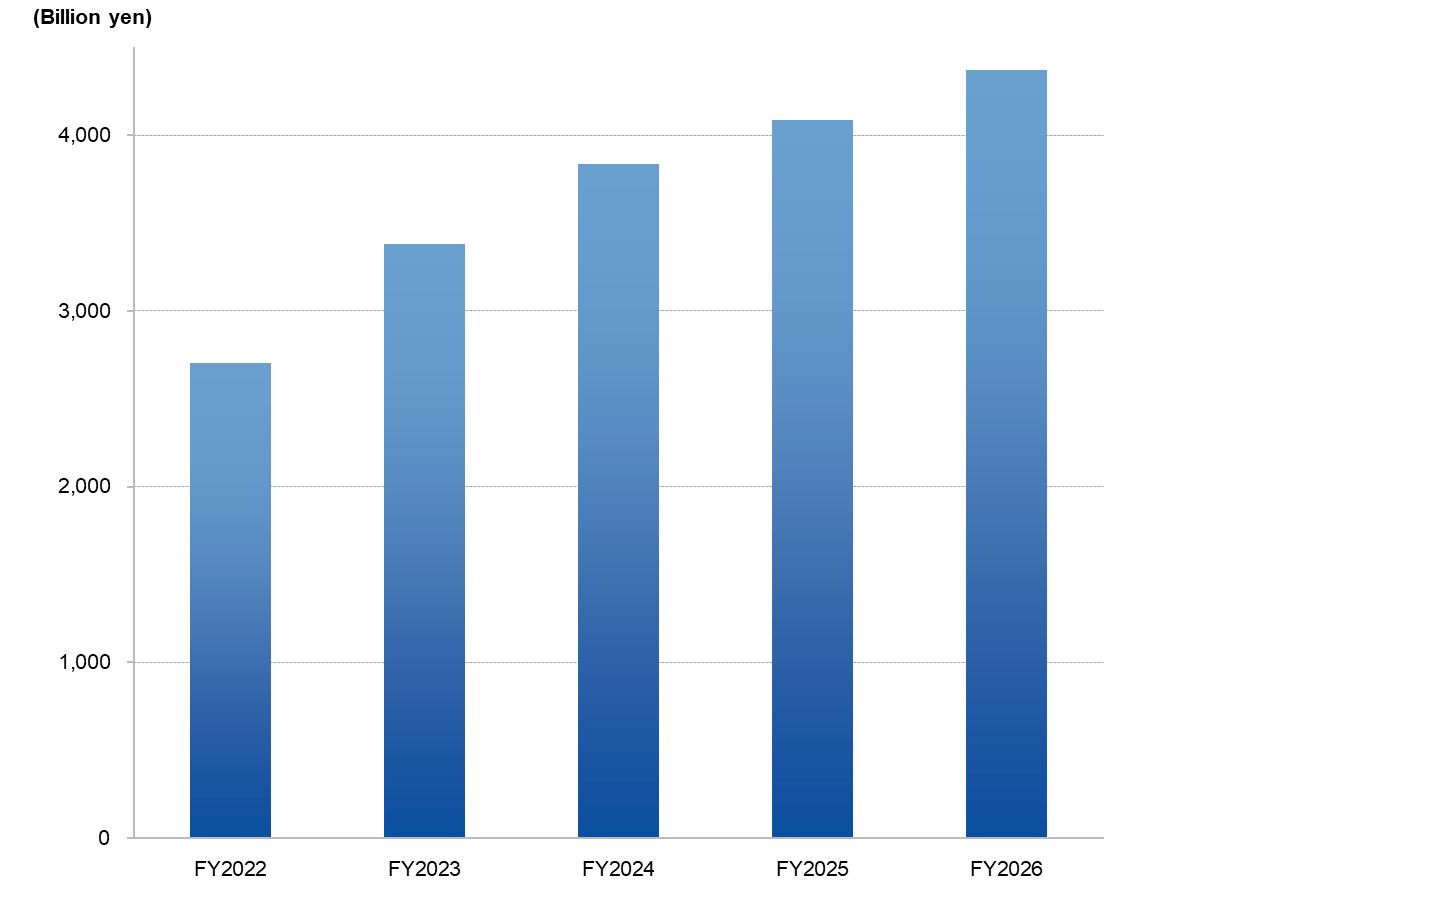
| (Million yen) | ||||||||||||
|
Operating Profit, Profit before Income Taxes and Profit
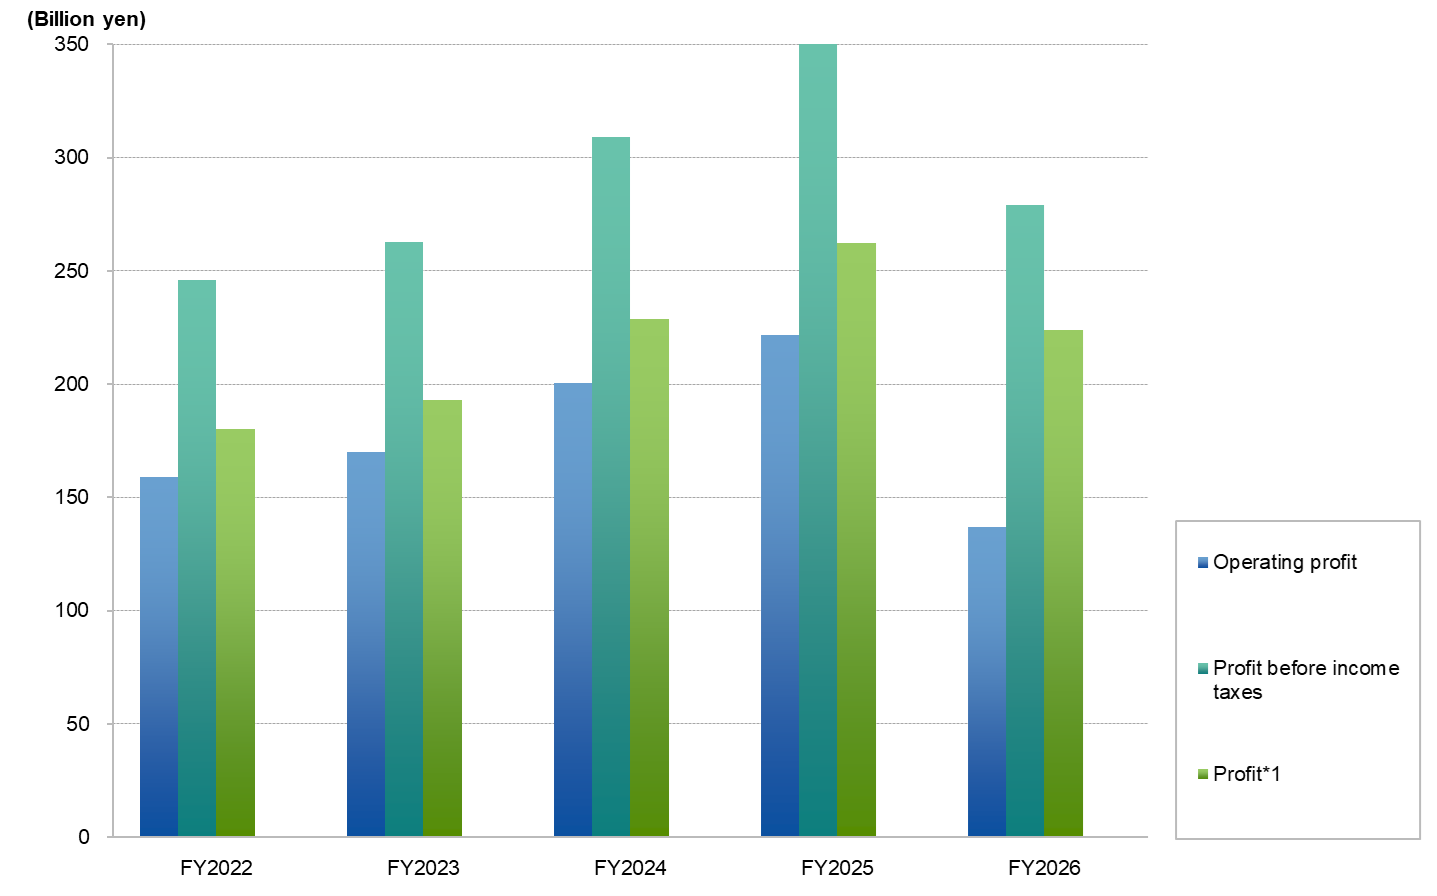
| (Million yen) | ||||||||||||||||||||||||
|
*1: Profit attributable to owners of the parent.
Investments in Tangible Assets and Depreciation
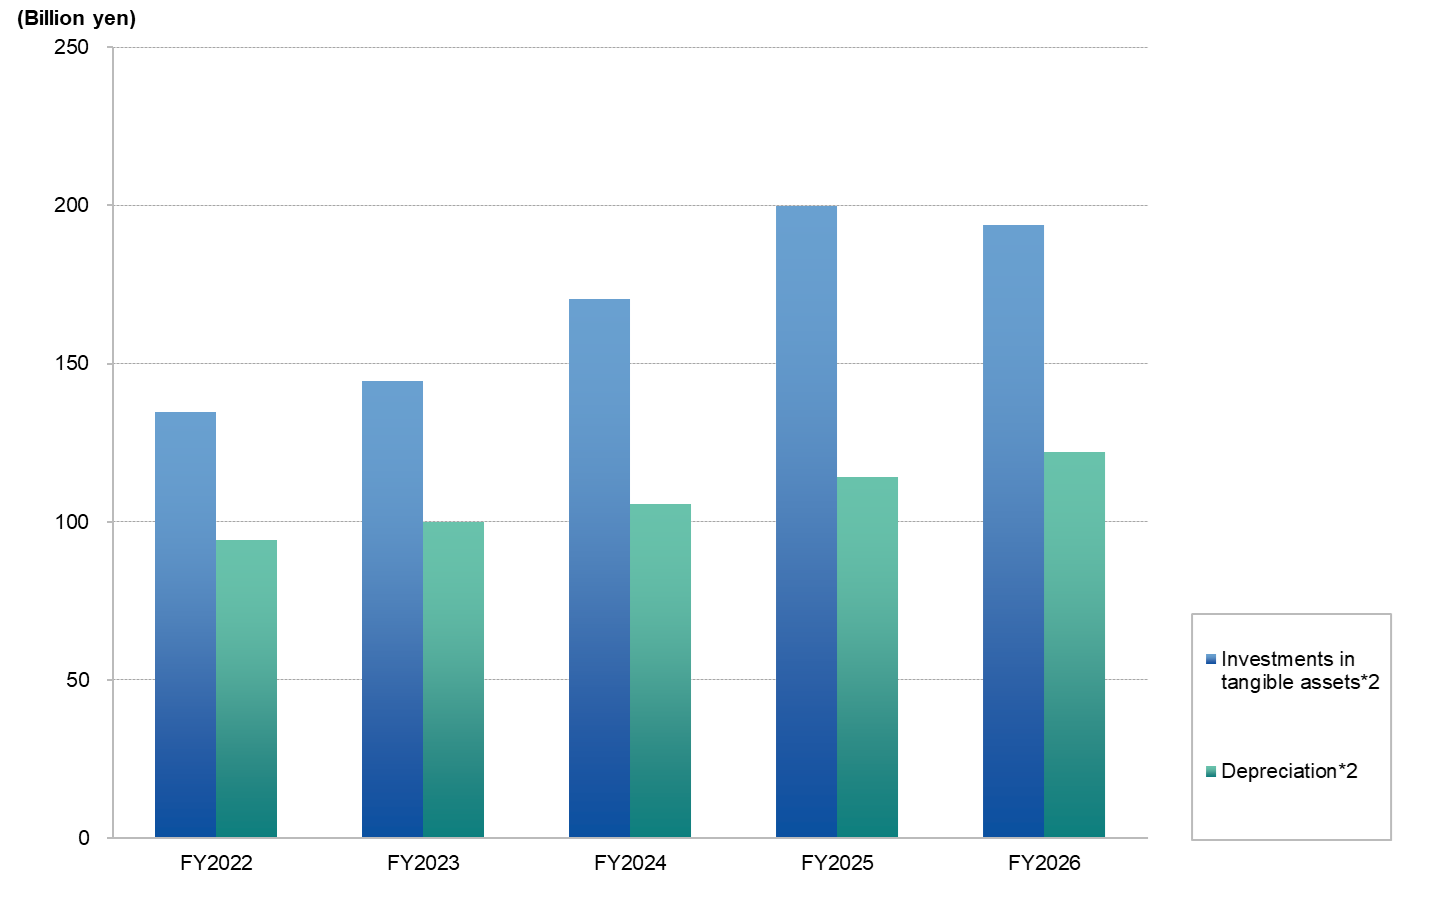
| (Million yen) | ||||||
|
| (Million yen) | ||||||||||||
|
| (Million yen) | ||||||||||||||||||||||||
|
*1: Profit attributable to owners of the parent.
| (Million yen) | ||||||
|